
Join us as we follow the market’s most significant events and provide technical analysis of the most important financial assets, so you are more aware of the factors driving daily price changes and economic data.
Today’s Economic Calendar
We follow today in GMT:
The German industrial production index for July will be released at 6:00 a.m.
– For the second quarter of the year, the eurozone’s GDP was ranked ninth.
– The previous week’s unemployment claims rate was released at 12:30 p.m.
– At 3 p.m., the previous week’s US oil inventory is released.
Top News in Global Markets:
yesterday’s most important events:
– The British PMI for construction was higher than expected in August.
– Eurozone retail sales were lower than expected on a monthly basis in July.
– The trade balance between Canada and the United States was higher than expected in July.
The Central Bank of Canada kept the interest rate unchanged at 5%.
– According to the Institute for Supply Management, the US service sector PMI was higher than expected in August.
– During the American session, the Dow Jones Industrial Index fell 198 points, and the Standard & Poor’s 500 Index fell 31 points.
And this morning:
– Australia’s trade balance was worse than expected in July.
– China’s trade balance for August was lower than expected.
– Asian session indicators fell, with Japan’s Nikkei Index dropping 219 points and China’s Shanghai Index dropping 18 points.
During today’s hours, we are waiting:
– The August unemployment rate in Switzerland.
– Monthly German industrial production index for July.
– The rate of change in employment in the eurozone during the second quarter of the year.
– The previous week’s unemployment claims rate in the United States.- US crude and natural gas inventories for the previous week.
Technical Analysis
Dollar Index – 4 Hours frame
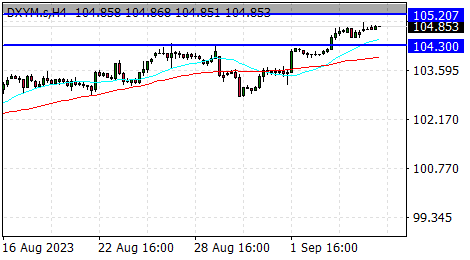
The US dollar index continued to rise since yesterday, supported by the US ISM services PMI rebounding hotter than expected to 54.5 in August, the strongest growth in the services sector in six months.
Technically, the index is still trading above the moving averages for a period of 20 and 50 days, so the index is likely to continue rising today to the levels of 105.20 points that we mentioned yesterday.
Gold – 1 Hour Timeframe
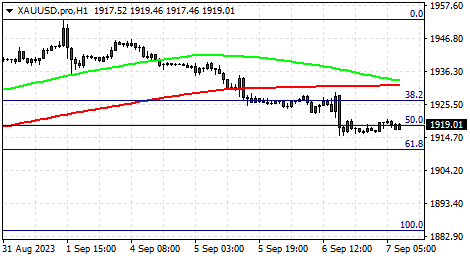
The price of the yellow metal rose to the level of $1920 as selling pressure continued and concerns persisted about the Federal Reserve raising interest rates at the next meeting.
Technically, gold is trading around the 50% Fibonacci area below the $1919 level, and we expect the decline to continue to the $1902 support, provided it continues below the $1923 resistance.
US Dow Jones – 4 Hours Timeframe
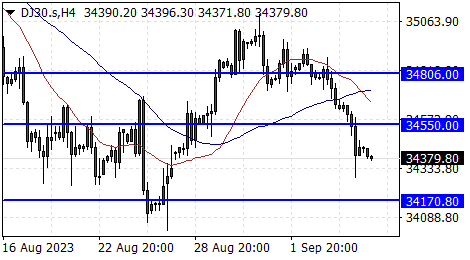
The Dow Jones Industrial Index continued its decline today, Thursday, Holding below resistance levels around 34550, as the moving averages began to show negative signs.
Technically, the index still has a bearish outlook, as the decline is likely to continue and the index will target support levels around 34,170.80 points.
US Crude Oil – 1H Timeframe
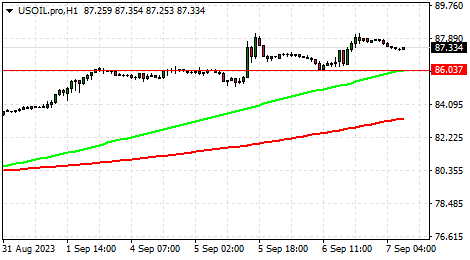
Oil prices fell to 87.50 after rebounding from a peak of $88.18 yesterday, but it remains in an upward trend supported by the Kingdom of Saudi Arabia and Russia continuing to reduce production.
Technically, oil is trading near the 100-hour moving average in a corrective downward movement that we expect to extend to the $86.00 level and then return to the rise again to the $88.18 peak.
GBP/USD – 1 D Timeframe
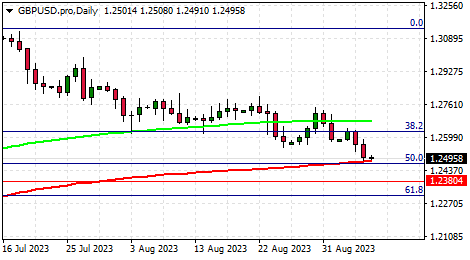
The GBP/USD pair continued to decline to the 1.2482 level after the cautious statements made by Bank of England Governor Andrew Bailey on Wednesday regarding stopping raising interest rates soon.
Technically, the pair is trading around the 200-day moving average of 1.2500, and we expect that if this support is broken, the decline will continue toward the support of 1.2380 US dollars.
AUD/USD – 1 Hour Timeframe
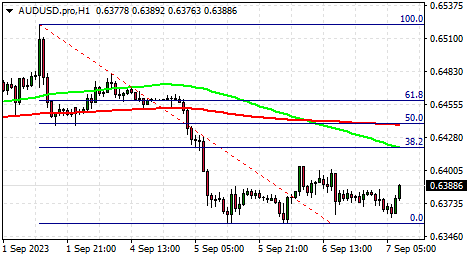
The (AUD/USD) pair fell to a low of 0.6380 yesterday, Wednesday, before returning again to the rise near $0.6400 after the Australian Central Bank Chairman’s tough statements.
Technically, the pair is consolidating above resistance at 0.6380 in an attempt by buyers to control prices, and we expect the rise to continue towards the 100 hourly moving average at the resistance of 0.6415 around the 38% Fibonacci retracement area.
USD/JPY– 4 Hours Timeframe
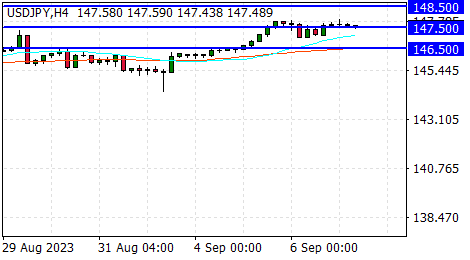
The USD/JPY pair is oscillating around the 147.50 resistance levels that we mentioned yesterday, but the signs still suggest a rise, supported by a decline in the economic indicators index in Japan, to the lowest level since April.
Technically, the pair is likely to continue rising during today’s trading, targeting resistance levels around 148.50 yen.